You’re a startup and it’s you (the CEO), your CTO and your marketing guy in the monthly board meeting, and your investors ask “so what did you learn from the marketing activities last month?” Don’t say something like “we’re not real sure”, or “traffic went up, but we don’t know from where” – or anything like that. In fact, make sure you don’t fall into the old adage “I know half of my marketing is working – I just don’t know which half.”
We’re a startup too, and we know you want to be a “traffic whore.” That’s fine – we are too – hell, we’ll link bait anything to get 2o more visits. But as much as you want to be a traffic whore, you need to be an analytics whore too.
In fact, we like analytics so much, it’s in our name – and we have the tools to boot. (yes, that’s a photo of my iPhone…so many analytics tools I had to create a whole folder for it). So we’re going to show you a few tools and techniques to get you to that next board meeting so you can put on a rockstar performance!
Tools
Google Analytics (Analytics Pro) – this should go without saying, but everyone should have Google Analytics running in their site. It’s free for chrissake.
Clicky – I run Clicky because I love the Spy feature where you can see who is on your site right now and what they are clicking on. Yeah, it’ll freak people out.
Chartbeat – this isn’t a traditional page analysis tool. This is about what’s going on right now. It shows you people who are currently on your site, the pages they are looking at, and the average page load time. This is cool for when you finally hit TechCrunch or Hacker News and you want to see the traffic spike real-time. Chartbeat is different from Clicky’s Spy feature because Chartbeat keeps track of active and inactive tabs that have your page open, so you can now see who’s actively reading (or not). On Clicky Spy, once they leave the tab (even if it’s still open), the live visitor count decreases.
Floorboard – this is our home-grown reporting engine. We also do a lot of cookie and session tracking, so I can track the behavior of account holders (like how often they log in, what they do when they log in), or the time it takes from the minute they hit the site, until they sign up for an account. Sometimes the data out of the database is more reliable than javascript trackers. Build one for yourself – if you need some help, let us know. There was also that great video from Mike McDerment over at Freshbooks on “Flight Systems”.
Pear Analytics – this is our SEO tool made for the iPhone. (Sorry, you can’t get it anymore off of iTunes because we’re going to make a waaaay better one soon.) Until then, you can use this free seo analysis tool.
KISS Insights (not shown) – you’re going to need a page level survey to ask people what they think about your tool or service. KISS gets a really high response rate, so you’ll get data very quickly that you can use in your next board meeting.
CrazyEgg – this is a heatmap tool that will show you the “hotspots” on your webpage. Are people clicking where you want them to? The results may surprise you. (And yes, I am pimping Hiten Shah a bit here with all of his tools, but hey – they guy is doing something right.)
Userfly – this is super cheap usability testing. They record the mouse movements of random visitors to your site. Are they doing what you want them to do? Did they see that forward to a friend button? Still a little clunky on ajax and javascript stuff, but totally worth the ten bucks or whatever it is.
Update 8/24/10 – thanks to Dan Martell for tweeting this post out – I totally forgot to add Flowtown to this list of must-have tools. Flowtown basically pulls a social profile on any email you have. So if you have a freemium product that asks for an email to signup, they will cross-reference the emails and find out who’s on any social network (Twitter, Facebook, LinkedIn, etc.), along with some basic demographics, AND who the influencers are. Now for you advanced users, try overlaying this data with the user behavior data in your database. Now you’re cooking 🙂
Techniques
Okay, now you have a shitload of tools – what do you do with them all?
1. Set up goals – both Clicky and Google Analytics have the ability to set up goals – or conversion places – or places where people do the things you want them to. This could be fill out a form, subscribe, or sign up. For Pear, it’s those who come and run a free report with our product. Now you can tell which traffic sources are converting the most.
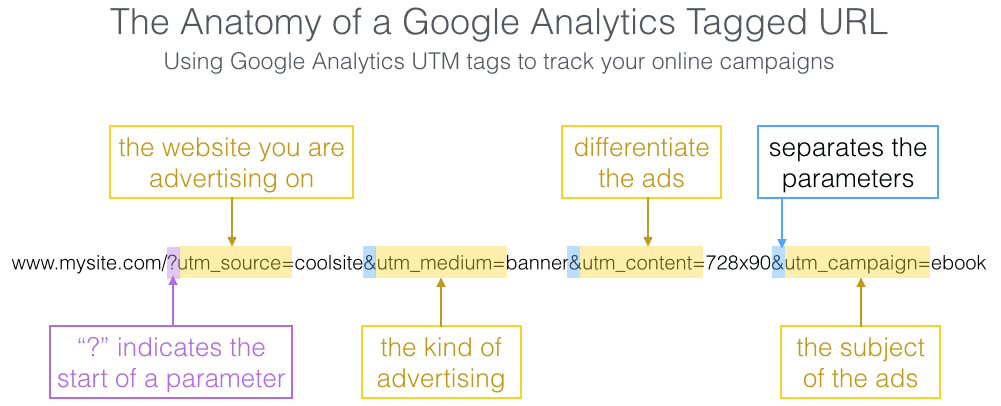
2. Take the time to add the proper tracking codes to your marketing activities – Google Analytics has a way to read special URL parameters so the data goes into the right place into the reports. If you’re running a banner ad on Mashable, don’t tell them to link to just www.yoursite.com. Append the URL like this:
www.yoursite.com/?utm_source=mashable&utm_medium=banner&utm_content=125x125a&utm_campaign=startups
Now you know which banners work the best, which campaign, which source, etc. You can even play with banner copy and calls-to-action now. Cool, right? If you need help building that URL, go here to the Google URL builder tool.
3. Build funnels for all of your activities – what you want to know is where people drop off during the process you take them through to sign up, pay you, or whatever it is you want from them. If you are using the DaveMcClure AARRR concept (Acquisition, Activation, Retention, Referral, Revenue) – with the exception of Referral, that’s your funnel. Make pretty little graphs for your board meeting too, like the ones below, for every marketing activity. If it’s hard to get some of the data, that because it is sometimes. Don’t whimp out. If you want, you can also try KISS Metrics to do a pretty schnazzy funnel analysis.
4. Segment, segment, segment – Google Analytics made the advanced segmentation module just for you. Want to know out of all of your new visitors, how many went to page X AND page Y? Create a segment. Or maybe you want to know how many visitors stayed at least 2 minutes, AND visited at least 2 pages (one of Dave’s acquisition examples). See how we segmented our top performing organic keywords using Google Webmaster Tools and Google Analytics together.
5. Test, test, test – you want to be split testing your copy, landing pages and anything that gets a user to try your tool, or ultimately pay for it. You might have to test different pricing structures, or even test certain features with cohorts of users. You want to develop your code in a way where it is “test friendly” too….Rails has a plugin called “A/Bingo” made by the guy who invented the Bingo Card Creator. There may be others out there, but in case there aren’t, you can try Google Website Optimizer or Unbounce.
6. Know your CPL, and if you have a paywall, know your CPA – your cost per lead (CPL) and cost per acquisition (CPA) is a great way to measure what marketing activities are working and which are not. Without doing this exercise, you may be tempted to stay with the cheaper form of marketing, even though it performs the worst. Now what should your CPA be? That’s up to you and your board to decide, and probably will be based loosely on what you know about the Lifetime Value of your typical customer or subscriber. Your CPL, however, should never really exceed about 15% of the CPA limit. That means if your CPA limit is $10 (you’re willing to spend $10 to acquire a paying customer), then you should see what marketing activities are giving you leads at $1.50 or less.
Wow! Now you can go back to the boardroom with some real insights and data to make decisions! And that’s what your investors want – they want to know what you learned from your experiments in trying to find a repeatable, scalable business model. We’re by no means the experts here, but if we can help you, please reach out to me – ryan at pearanalytics dot com. Oh, also be sure to read Steve Blank and Eric Ries.