We’ve been using the heck out of the annotation feature in Google Analytics, and here’s why: because we can correlate traffic to activity.
For the most part, it’s going to be your marketing activities. But it could be things like you were on vacation from date A to date B, and maybe that’s why your traffic went down. Or maybe your server was down on Friday morning, and that’s why your traffic came to a screeching halt.
I’ve also been annotating when we send emails out to our user base as well, even though MailChimp does a good job of tying into Google Analytics – I’d rather just roll over the note on the graph, rather than have to pinpoint the date range, and then go and look at the Visitor Sources.

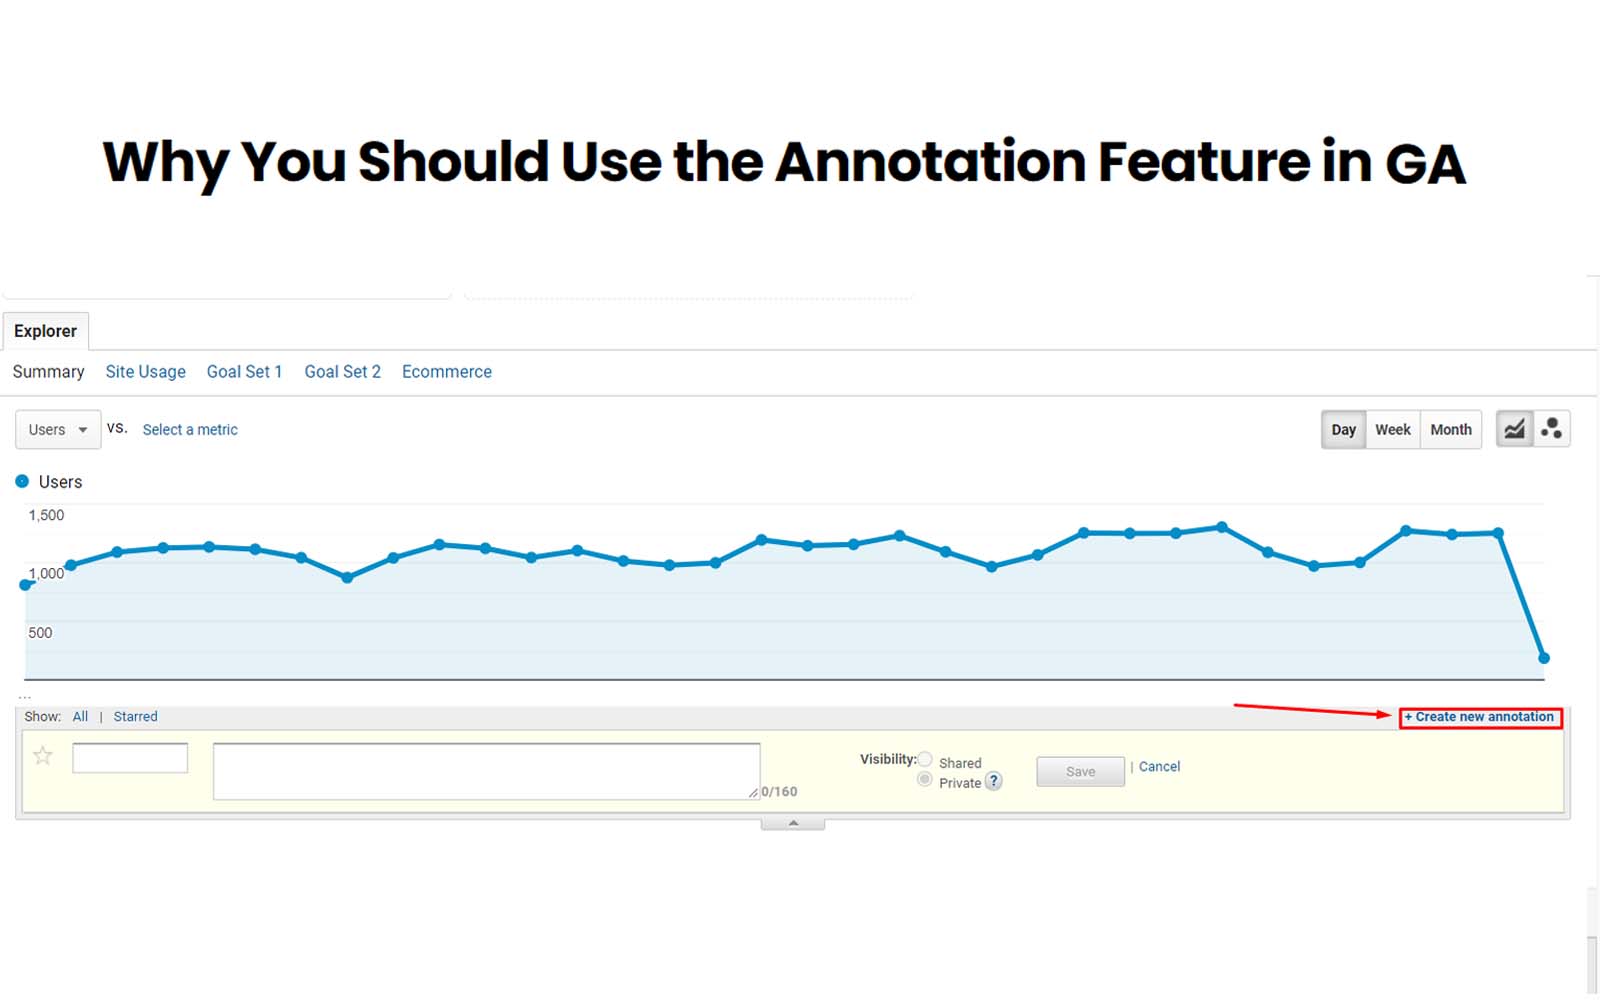
To add a note, simply roll over the date you wish to add a note to, and then click the “Create new annotation.” It’s quite simple. Other folks who have access to your account can also add notes, and it will track who said what. While it does allow you to add multiple notes on a single date, it does not allow you to create a note over a date range. Bummer. That would be useful if for instance you did a direct mail drop over a 3 or 4 day period, right? Maybe they’ll add that later, but for now you just have to hack it by putting a note for “direct mail start” and another note for “direct mail end” or something like that.
Either way, it’s a pretty cool feature, if I do say so myself.