Wikipedia defines a regression analysis as “a statistical process for estimating the relationships among variables”. Simply put, a regression analysis can tell you how one variable affects another variable. In this analysis the first variable is called an “independent variable” and the second is aptly named the “dependent variable”. In multiple regression you can add as many independent variables as you want and see which, if any, affect this dependent variable and by how much. This is the basis for the following SEO analysis.
Since I’ve been at Pear I’ve been doing on-page optimizations for clients’ websites consistently. Initially we would create ornate reports instructing clients how to make changes themselves and where these changes will show up on the page. Eventually we then moved into the more turnkey solution of making the changes ourselves. With this change came a certain sense of responsibility. Not just for making sure we don’t breaking the clients’ websites, but also for keeping track of what was changed so we can demonstrate our success (usually seen in keyword rankings). Because we are pretty efficient at making these changes on the websites, it‘s pretty rare that a client asks exactly what was changed and how. It made me wonder for what purpose we were compiling this large database of page optimization records. I think it was a strategic planning meeting almost a year ago that I first pitched the idea of using this data in conjunction with our tools that track current keyword performance to build some sort of ranking prediction. Ideally the sales team would be able to use this tool to give clients a good guess as to their visibility increase organically given their specific metrics (competitive space, domain authority, CMS, etc.).
I’ve since learned about the power of simple and multiple regression and just how helpful it can be to predict a dependent variable such as keyword ranking improvement. The first step was to find out what data we had and what was relevant. For each client we have the keyword optimized around, the ranking of that keyword at the time, the page altered, and the number of changes we deemed it appropriate to make. Given this keyword, I could reference AdWords to find both the average monthly search volume and competitiveness. As I’ve written about before, I don’t usually take AdWords search volumes at face value and I am equally suspicious of their competitiveness measure, but I figured that all the keywords chosen were probably equally as biased as long as I pulled Google’s search estimates for each and pick keywords of similar popularity.
So after compiling a group of about six clients (and roughly 100 observations), I pulled the current ranking data and calculated an improvement variables (init.rank – curr.rank). This improvement metric would be my dependent variable at which the regression analysis would try to explain by the combination of my independent variables.

My next step was to decide which variables to include in my regression. Initially I thought adding a Boolean variable to connote if the page was a homepage would be valuable because typically homepages tend to have the most links and thus the most page authority on any given site. I included this, the site’s domain authority, keyword search volume, competitiveness of keyword, number of changes made on the page, and the initial keyword rank at the time of the optimization in the regression and let SPSS do the work. You can see the output below.
The first metric I looked at was the Adjusted R-Squared value. The .230 means that the following regression of the independent variables accounted for 23% of the variation in keyword ranking improvement. This doesn’t seem great, but from what I’ve learned playing with real world datasets is that often times you can’t explain everything. I figured 77% unexplained left a good amount to be desired though so I brainstormed on how to make my data more logical. There were instances (only a few) where a keyword actually got worse after the page optimization. Maybe this keyword got more competitive or it wasn’t relevant to the website. Either way, I figured a negative improvement would confuse SPSS and if I was going to assume page optimization yield an improvement in ranking (which I think we can all assume) then I should only select the cases in which improvement is great than 0.
I also focused on trying to simplify my independent variables. The Adjusted R-Squared figure somewhat penalizes you for including too many variables in an attempt to explain all aspects of your dependent variable. Simply put, the fewer very relevant variables you regress, the higher your Adjusted R-Squared and thus the more your regression makes sense. So given that this tool would primarily be used for sales I figured I would eliminate some variables that may not be easily inferred without access to a potential clients’ sites (number of variables changed). I also figured that while it is interesting to look at the homepage’s effect on improvement, this is usually biased because homepages usually already rank strongly and thus the improvement is marginally lower.

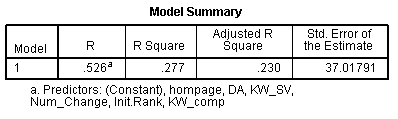
So I ran another regression, with fewer cases (only positive improvements from non-homepages) and variables (keyword search volume, competiveness, domain authority, and initial rank) and got the following results:

As you can see I am now explaining 53.5% of the variation in improvement with my four variables. Again, it doesn’t seem like anything groundbreaking, but if I can explain roughly half of Google’s ranking algorithm with four variables, I’ll call it a win. The next thing to look at is the F-statistic (13.084) and T-statistic of the individual variables. You’ll see that the F-statistic is large enough to prove this regression significant with 95% confidence given the sig. of less than .05. However, of the variables and intercept, only the initial keyword rank is a significant independent variable. This could be caused by many things: perhaps my sample size isn’t big enough or perhaps there is some multicollinearity within variables. Multicollinearity occurs when you have multiple variables that explain aspects that are too similar to the dependent variables. Thus SPSS does not know which of the variables is causing the impact.
In either event, more data needs to be input to explore further. In the meantime I think this is an interesting practice to learn which variables affect our end goal as an SEO company. An SEO analysis like this is helpful to really quantify how important the changes our team does to a client’s website. It also serves as a good example of how you can turn the burden of extraneous data into a useful tool via regression analysis.