Last week we did a test to see the performance of a sponsored post on LinkedIn vs. Facebook and were interested to see which one would lead to more downloads of our free workbook, the Online Marketing Budget Planner. Both were set up on the same day and ran until a $200 budget on each network was exhausted.
Facebook Sponsored Post Setup
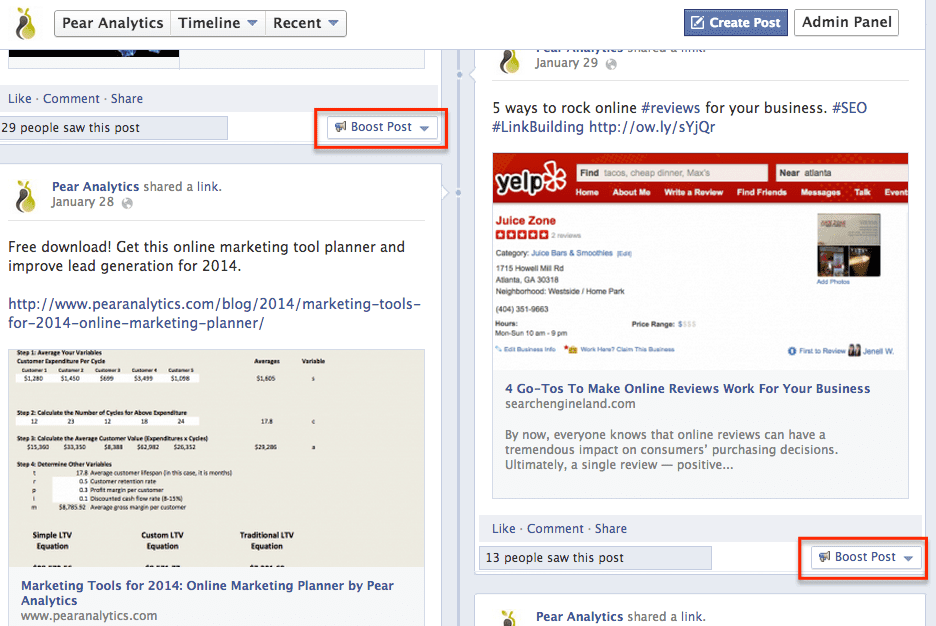
The setup is very easy. Once your page or post has been added to the company page timeline, in admin mode you can choose to “Boost Post” on any of them:
I then chose a variety of settings to target who would see the sponsored post, so naturally people in marketing, advertising or even social media. I wanted the sponsored post to only show in the US, and only to men and women between the ages of 30 and 45. This resulted in a possible 720,000 people who could see the ad, and it turns out $200 won’t even get to 10% of them (more on results in a bit).
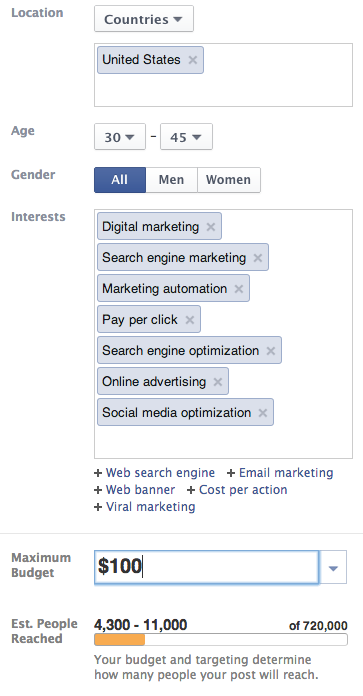 From there, I just set the spend to $200. The system gives you a range of minimum CPC (Facebook is a cost per click system), which in my case was suggested at $3.15 per click, so I left it alone. Once you approve payment, there is a quick approval process within Facebook’s advertising system, and then you’re up and running usually within an hour.
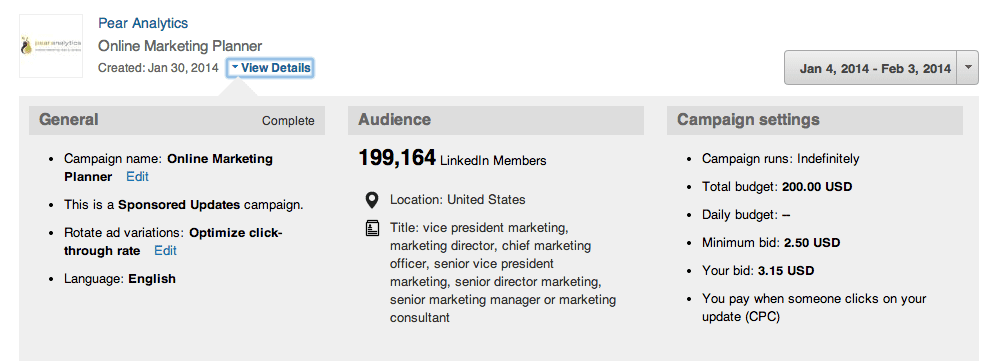
LinkedIn Sponsored Post Setup
The LinkedIn system is strikingly similar to Facebook’s – or vice versa – but again, all you need to do is go to the company page and click on the “Sponsor Update” button and go through a very similar process of choosing your demographics.
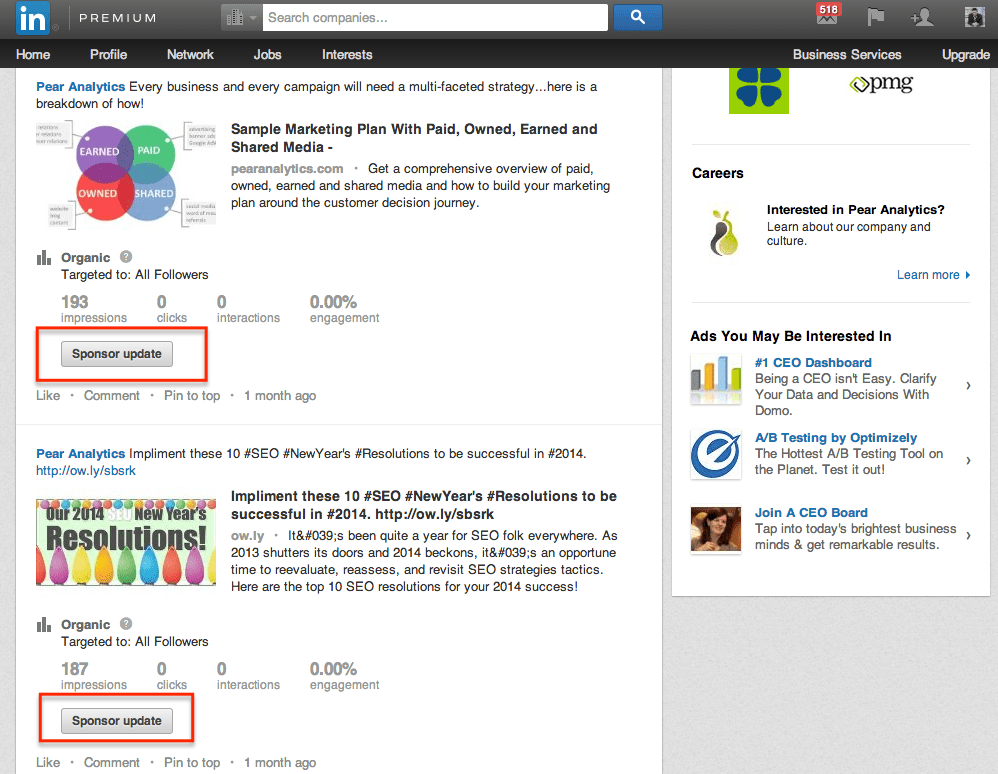
In this case, I chose very similar settings as I did on Facebook, and interestingly, the number of potential people to reach was considerably less – just under 200,000 people in the marketing industry. I could have probably chosen more, but my $200 wasn’t going to get very far anyway, so I just went with the 6 or 7 senior positions I could think of, and set the budget to $200, just like Facebook.
Both of these campaigns ran only for a couple of days until the budgets were exhausted. Each ad – or sponsored post – took the visitor to the blog post which explained the Online Marketing Planner, and from there they had to click through to the download page and give some information in order to receive the workbook. So essentially, we had 3 conversion points in the funnel (ad to blog post, blog post to download page, enter info) which may or may not be optimal, but we can discuss possible improvements after the results.
Try the PPC Budget Calculator
Find out in seconds how much you should budget for your pay -per-click (PPC) campaign. All you have to do is enter the keywords, and we will show you everything you need to know to make the right decisions based on data.

Results of Facebook and LinkedIn Sponsored Posts
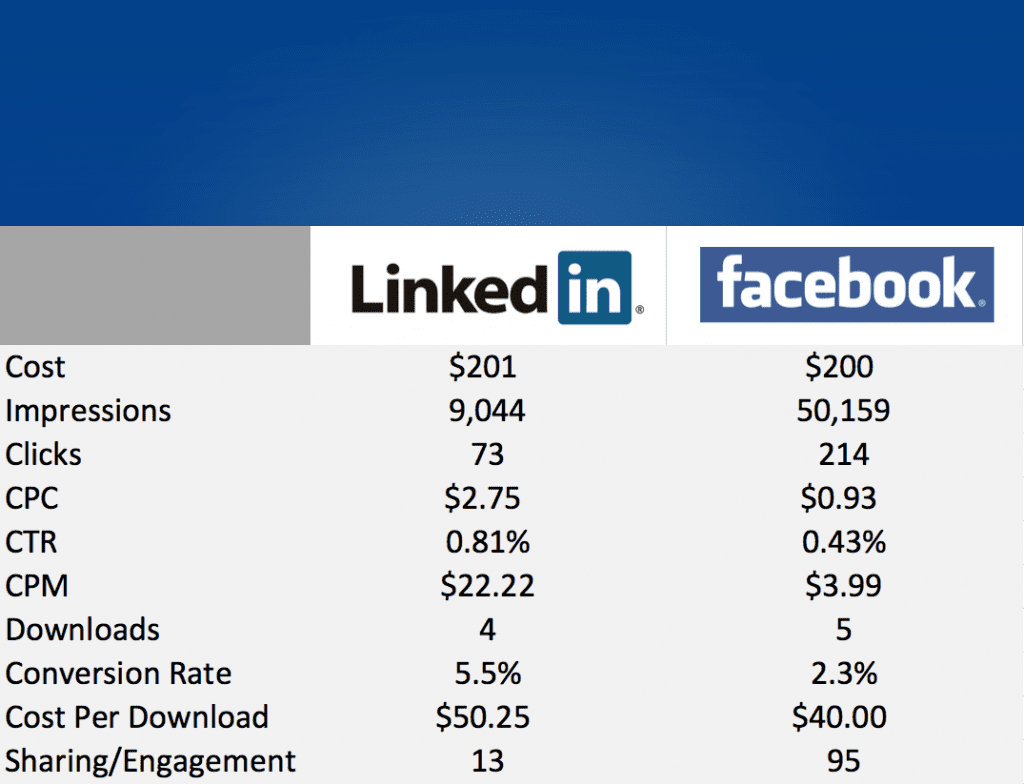
The results were quite interesting. We got a total of 9 downloads of our free workbook: 5 from Facebook and 4 from LinkedIn (taken from Google Analytics). That’s $40 per download from Facebook, and about $50 per download from LinkedIn (LI went a little over the $200). The reporting on LinkedIn’s platform is much more comprehensive than Facebook’s, in my opinion. Here is LI’s:
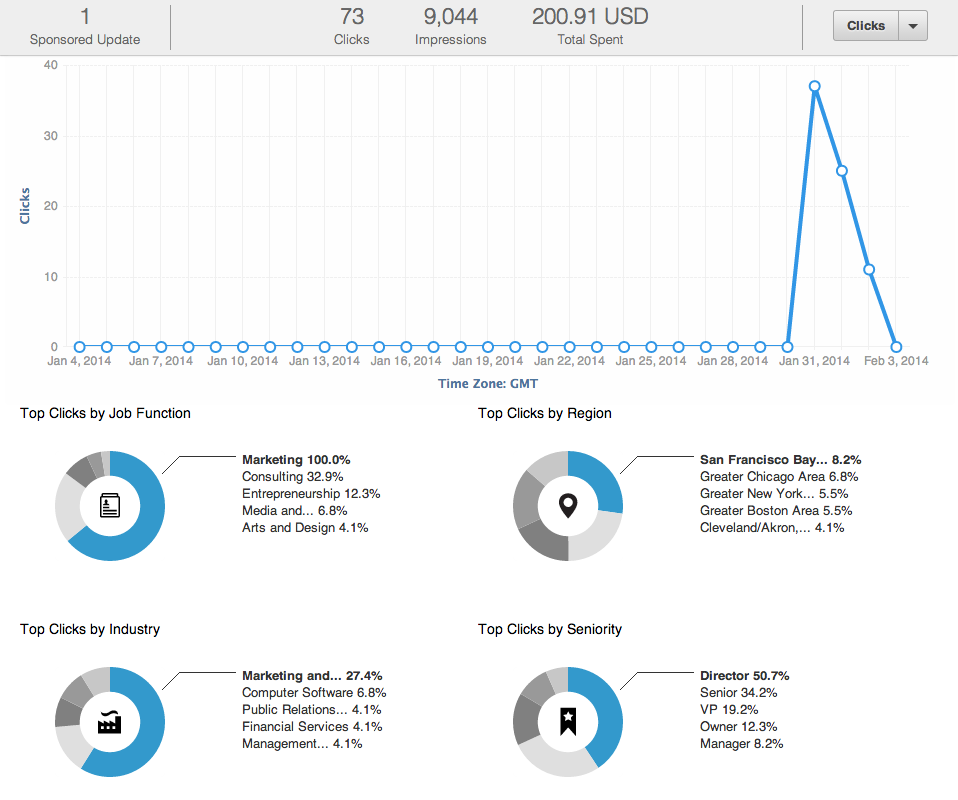
So for LinkedIn, we paid $2.75 per click, or an equivalent of $22.22 CPM (quite expensive, even for a targeted audience). The click through rate was 0.8%, which is probably 3-4 times better than a normal CTR we would see on a display campaign in Google Adwords. We barely reached 5% of the total audience selected for targeting, and that’s assuming there weren’t more than one impression for anyone. The 73 clicks resulting in 4 downloads is a 5.5% conversion rate through the entire 3-step funnel. If I wanted to reach the entire audience, it would have cost us over $4,200 and given us about 86 downloads total. Additionally, LinkedIn added 13 social actions which would include a like, share, comments or follows to our company page. That’s only 17.8% out of those who clicked.
Let’s see how Facebook faired:
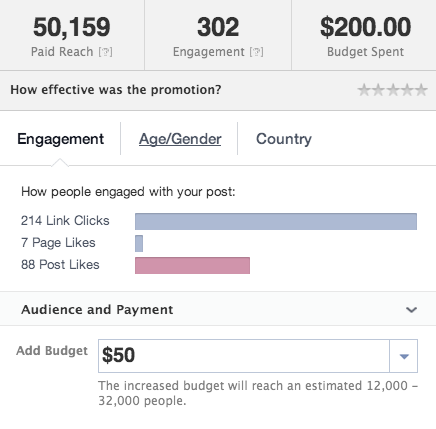
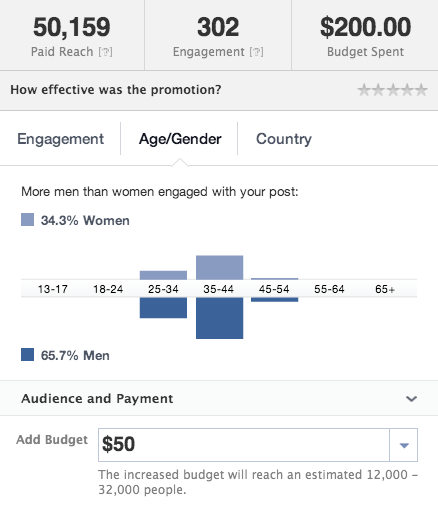
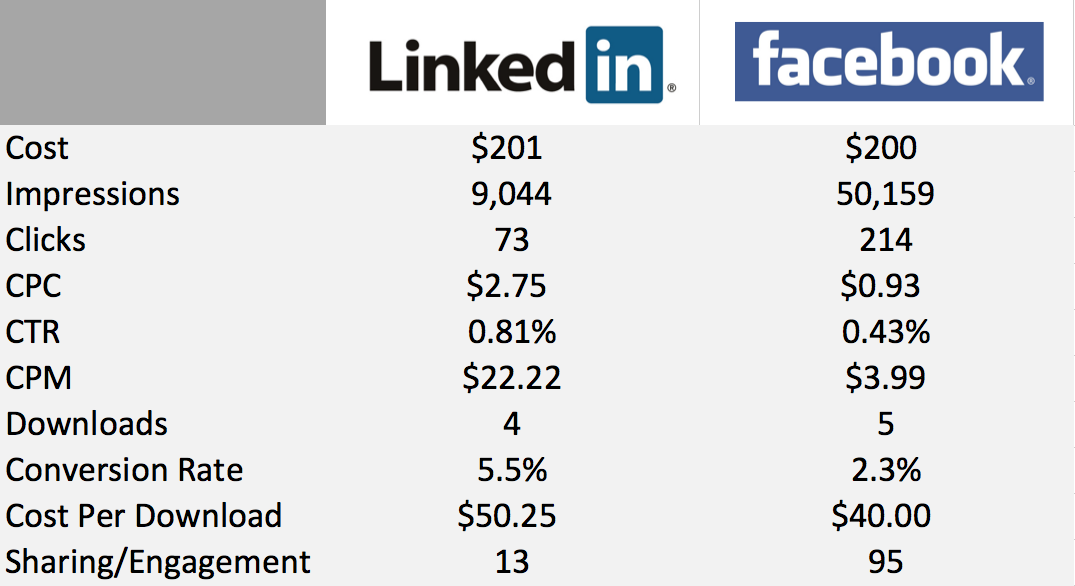
The data shows that we got a lot more reach and engagement with Facebook. We paid the equivalent of $0.93 per click and $3,99 CPM. The CTR was about half of LinkedIn at 0.4% We reached only 7% of the potential audience with the measly $200 test spend. The conversion rate on Facebook was far worse at 2.3% going through the 3-step funnel. Facebook showed more social sharing on the post coming in at 95 interactions – over 7X more than LinkedIn. Here is a better organized summary:
Some Initial Ideas on How To Improve Conversion Rates and Performance
In conclusion, the end result (downloads) were almost identical, and the real result will be which of the folks who gave their information for the download become actual leads. It was a little difficult to trace back the original source of the download, and neither Facebook or LinkedIn seemed to offer any special tagging capability so I could delineate in analytics which leads were from where. So here are some ideas:
1. If I were spending a lot more money – say, more than $1,000 – on either of these platforms, I would take them to a specific page for the download, and then create a unique thank you page for each. I think the lack of utm tags available in the platforms is problematic if you want to get really granular with results.
2. I began to wonder if the design of the workbook wasn’t inviting enough – or played a part in the low conversion from blog post to download page (73 to 5 for LinkedIn, and 214 to only 6 for Facebook -wow!). That said, those who did reach the download page pretty much all gave us their info. I think reducing the number of steps in the funnel would make a big difference here – but then it wouldn’t really be a “sponsored post” then.
3. Many of the visitors were from a mobile device, particularly Facebook. Since our site and blog is not mobile-friendly or responsive (yet), I wonder how that played into conversion rates. Again, if I were doing many of these types of ad placements on a larger scale and spending more money, I would probably invest in the responsive design as well to make sure they don’t leave because of squinting and pinching.
What do you think would have improved this campaign?